Click on the Graph for a larger view.
The problem with rules of thumb is they work thumb of the time.
Consider, one of the old rules of thumb on market evaluation is based on the Price/Earnings ratio (P/E) of the market. Historically, this number averages out around 16. If the current P/E is over this number, it is probably not a good time to buy. If the P/E ratio is lower than 16, it is a good time to buy. Some pundits extend this logic to individual stocks, although in many individual situations a P/E of 16 is not significant. Small new companies with a steep growing curve will have much higher P/E ratios. Banks and large established companies will typically have much lower P/E ratios.
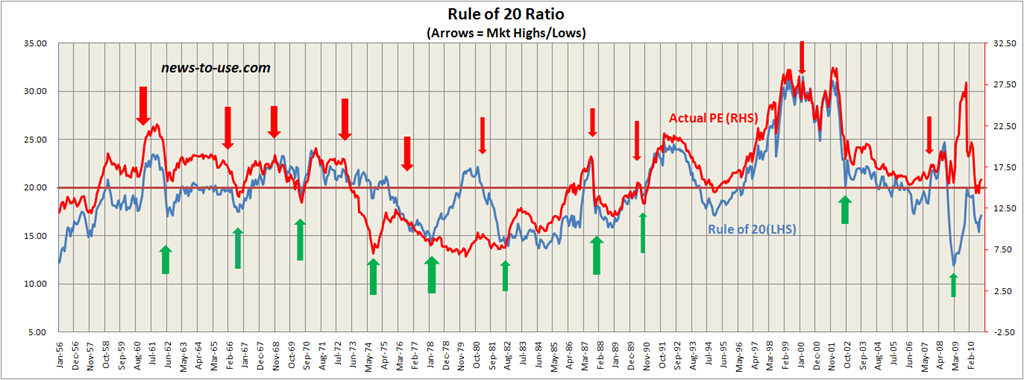
In an article entitled The Rule of 20 Equity Valuation Method, Dennis Ouellet looks at a more meaningful variation on this theme. Over the past 80 years, the market P/E less the rate of inflation varies between 15% and 25%, averaging about 20%. When this number drops very far below 20%, a blind monkey could pick winners from a list of stocks. If the number gets up towards 25%, sell everything. The evidence the article presents successfully demonstrates this method produces better results than just looking at market P/E without considering the rate of inflation.
What does this method tell us about the current situation? There are some problems. Just exactly what P/E should we be looking at; the entire market, the S&P 500, or the stodgy old Dow? I would consider the Shiller P/E ratio the most useful. It is currently at 22.5. Way over 16. Less 3% inflation we are looking at a rule of 20 P/E of 19.5, a number much closer to the historic norm.
There are other rules of thumb. For example some people look at various payout numbers. The average dividend on the S&P 500 is barely over 2%, near a historic low point of just over 1% prior to the dotcom crash of 2000. The historic norm is about 3.5%. This rule tells me it is not a good time to invest. A number like this would be screaming sell, but the Federal Reserve Bank and the Treasury are dumping money into the economy at an unprecedented rate. This drives down dividends as investors turn from bonds and invest in riskier stocks for higher returns.
(The Dow Jones Industrial Payout + The Rate on 3 Month T Bills) divided by 2 is called the Payday Indicator. Currently this number is running about 1.25%. This indicator tells me it is a very bad time to do anything.
But I still have to do something. Some of my investments, such as my retirement account at work are on autopilot. Essentially, with maybe a once or twice a year tweak, I am dollar averaging over an extremely long time frame, 27 years. This seems to work OK with an age appropriate diversified mix of stock and bond funds.
Personally, I am looking at After Tax Corporate Profits as a Percentage of GDP. That number is around 8.8%, near the abnormal and probably unsustainable historic high of about one year ago, 9.8%. By the way, those numbers were read off a graph by eyeball.
Corporations have benefited from low interest rates. They have refinanced their old debt at the new lower levels, outsourced jobs to foreign countries, and invested in automation to replace their American employees. This has been very good for their bottom line, but I think that number will continue to decline. Since the price of a share of stock is ultimately based on future earnings (which are pretty difficult to predict with any accuracy) and I believe earnings are headed down, I am not buying much. As readers of this blog know, I believe age appropriate stock holdings for someone of my age (61) should run between 40% and 55% of an entire investment portfolio. Because I believe the market is overvalued, I am near the lower number in that range.
But then if I really knew what I was talking about, I wouldn’t be working for the Federal Government. Time will tell whether I am right or wrong.
One more thing, “Let’s be careful out there!”

No comments:
Post a Comment